Assessing Our Civilization's Future Energy Needs
Arthur Woods / 21-12-2013
Introduction
This article attempts give us a glimpse into the future energy needs of our civilization by examining the predictions and recommendation of recently published studies by the three of the world’s most prestigious energy organizations: the World Energy Council (WEC) in cooperation with the Paul Scherrer Institute (PSI), the U.S. Energy Information Administration (EIA) and the International Energy Administration (IEA). Each organization has provided quantifiable predictions about the future energy needs of society by mid-century and how these predictions will be fulfilled. This article concludes, with a projection about the potential size and value of the energy market in the same time period and the implications for The Space Option.
Each of these energy organizations and their reports discuss energy values using different measurements such as: BTU – British thermal units, EJ – Exajoules, MTOE – Million tons of oil equivalent and BOE - barrels of oil equivalent. As this is confusing for the non-specialist and as it makes these reports difficult to compare, for the purposes of this article we have converted and harmonize the respective published energy values and measurements so that they can be compared with each other. This should help us to arrive at an accurate energy assessment.
In order that the reader can validate and crosscheck our assumptions and conclusions, all of the values mentioned in this article are derived from the specific reports and/or are referenced. Our conversion methods are described in the text and are referenced at the end of this article where we provide links to several web sites that offer online forms for making the conversions.
IPCC Intergovernmental Panel on Climate Change
As all of the reports take into account the recent the recent assessment Climate Change 2013: The Physical Science Basis [1] by the Intergovernmental Panel on Climate Change (IPCC) which has reinforced the dire predictions of its earlier assessments about the impact and influence of human activities which they assert is leading to a change in the climate of the Earth specifically called: Anthropogenic Global Warming (AGW) or Catastrophic Anthropogenic Global Warming (CAGW). They predict that a warmer planet will lead to a rise in sea levels, ocean acidification, a shift in food productions regions and more migration pressures. They also report that a large consensus – some 97% - of the scientific community support this view. One of the new key findings of their 2013 report was that humanity needs to emit no more than one trillion tons of carbon in order to stand a good chance of limiting global warming to 2 °C. They also point out that CO2 stays in the atmosphere for centuries with the result that its build-up is cumulative and more than half of the trillion tons of CO2 has already been emitted since the beginning of the industrial age and if current trends are accurate humanity will reach the this trillion ton threshold in the year 2040. To avoid doing so, CO2 emissions have to fall by 2.48 percent a year, and to keep on falling at that rate until they eventually reach zero. [2, 3, 4]
Put quite simply, the IPCC believes these trends could compromise the sustainability or our civilization if human activities lead to passing the trillion ton CO2 threshold in the year 2040. It should also be noted that measures and investments which will be necessary to remove or reduce levels of CO2 in the atmosphere such as carbon capture storage and sequestration (CCS) technologies will add significantly to the overall costs of energy in the future.
As we will see in the reports by the energy organizations, meeting the world’s energy needs in the years 2035-2050 with sufficient energy levels and at the same time meeting the specific goal of limiting CO2 emissions to the trillion ton cap poses a major challenge for our global society. This situation is already exerting much influence on governmental and industrial policies as well as on the actions and aspirations of every human being alive today.
World Economic Council / Paul Scherrer Institute
In January 2012 the Paul Scherrer Institute (PSI) of Switzerland and the World Energy Council (WEC) established a partnership aiming to elaborate comprehensible scenarios for global energy supply in the year 2050, and to examine the implications of these scenarios. Their goal was to answer the question: “How will the world secure its energy supply in 2050 and what are the possible economic, ecological and social, implications of different pathways and choices?”
Their report: “World Energy Scenarios: Composing energy futures to 2050” published in October this year states that the global population in the year 2050 will be between 8.7 and 9.4 billion people and global economic production will be at a minimum twice as high as it is today. By the year 2050, China and India are likely to replace Europe and North America as the largest economic spheres, while the population will grow fastest in Africa. Long-term projections for global economic growth will average about 3% per year in the developed countries and will be more in the developing and emerging economies. They discuss what this means for the world between now and the year 2050 in the areas of energy resources and energy supply as well as for CO2 emissions.
In this context, the WEC/PSI report indicates that our primary energy source in year 2050 will still be mostly derived from fossil fuels – mainly from oil, natural gas and coal. They developed two societal energy scenarios and used musical metaphors to name the scenarios Jazz and Symphony. In short, the market driven Jazz scenario produces more energy and more prosperity with less government intervention, yet at the expense of higher CO2 emissions. The Symphony scenario results in a drop in CO2 emissions at the expense of prosperity, higher costs and more government intervention such as in the areas of subventions of alternative energy production and through carbon capture storage and sequestration (CCS) technologies.
The WEC/PSI report estimates that total primary energy supply (TPES) (equal to consumption) will increase globally from 546 EJ (152 PWh) in 2010 to 879 EJ (144 PWh) in the Jazz scenario and 696 EJ (193 PWh) in the Symphony scenario in 2050. This corresponds to an increase of 61% in Jazz scenario and 27% in Symphony scenario in 2050. [ 5, 6, 7]
U.S. Energy Information Administration International Energy Outlook 2013
In July this year, the U.S. Energy Information Administration (EIA) released its International Energy Outlook 2013 (IEO2013) which projects that world energy consumption will grow by 56 percent between 2010 and 2040. Total world energy use rises from 524 quadrillion British thermal units (Btu) in 2010 to 630 quadrillion Btu in 2020 and to 820 quadrillion Btu in 2040. [8, 9]
Much of the growth in energy consumption occurs in countries outside the Organization for Economic Cooperation and Development (OECD), known as non-OECD, where demand is driven by strong, long-term economic growth. Energy use in non-OECD countries increases by 90 percent; in OECD countries, the increase is 17 percent. The IEO2013 Reference case does not incorporate prospective legislation or policies that might affect energy markets.
Renewable energy and nuclear power are the world's fastest-growing energy sources, each increasing by 2.5 percent per year. However, fossil fuels continue to supply almost 80 percent of world energy use through 2040. Natural gas is the fastest-growing fossil fuel in the outlook.
The industrial sector continues to account for the largest share of delivered energy consumption; the world industrial sector still consumes over half of global delivered energy in 2040. Given current policies and regulations limiting fossil fuel use, worldwide energy-related carbon dioxide emissions rise from about 31 billion metric tons in 2010 to 36 billion metric tons in 2020 and then to 45 billion metric tons in 2040, a 46-percent increase.
With the Brent crude oil spot price averaging $112 per barrel in 2012, and EIA's July 2013 Short-Term Energy Outlook projects averages of $105 per barrel in 2013 and $100 per barrel in 2014. With prices expected to increase in the long term, due to demand from the developing countries and increasing world population, the world oil price in real 2011 dollars reaches $106 per barrel in 2020 and $163 per barrel in 2040 in the IEO2013 Reference case. [9, pp.14]
International Energy Agency (IEA) : World Energy Outlook 2013
The IEA World Energy Outlook 2013 only looks into the future as far as year 2035. In their 2013 Key World Energy Statistics we find the following graphic which gives additional insight.
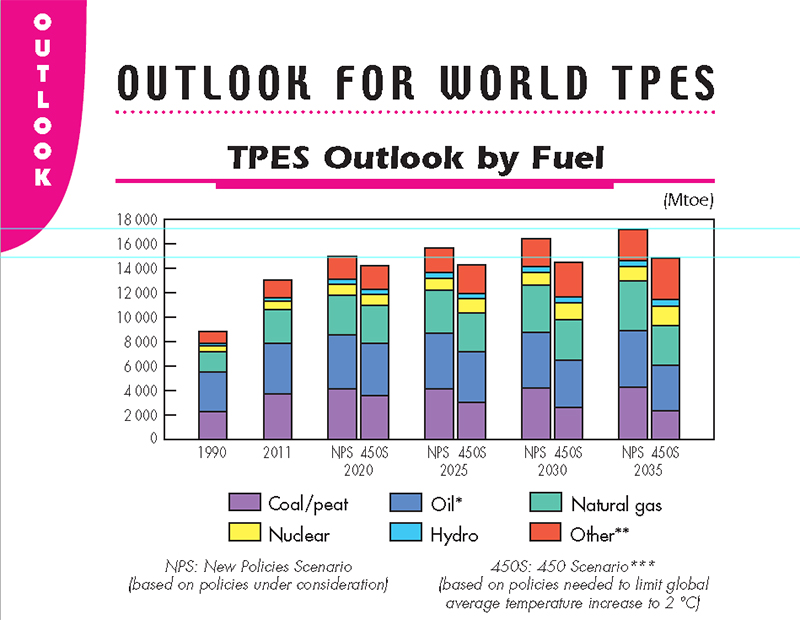
[12: IEA: Key World Energy Statistics, pp.46]
Here, too, we have two energy scenarios: the New Policies Scenario and the 450 Scenario with the latter emphasizing governmental measures to limit and/or capture CO2 emissions. Also we find yet another way to describe energy consumption - in this case Mtoe – Million tons of oil equivalent. Without being 100% accurate the above chart gives us the approximate projected values for the Total Primary Energy Source (TPES) for the year 2025 i.e. 14,200 Mtoe in the 450 scenario and 15,800 Mtoe in the NPS scenario. For the year 2035 we have 14,800 Mtoe for the 450 Scenario and 17,300 Mtoe in the NPS scenario. [10, 11, 12, 13, 14]
Making Some Comparisons
In this section we will attempt to compare the predictions of the three reports by converting all of the energy measurements into a comprehensible table. As the price of a barrel of oil is something most people can relate to and, not to favor a particular organization, we will introduce a common way of discussing energy which has been used for years which is the term: Barrels of Oil Equivalent or BOE.
Roughly speaking one Barrel of Oil = 42 U.S. gallons = 5,800,000 Btus. As the energy value of a BOE may vary depending on the actual quality of the oil we will use the online energy converter Unit Juggler instead. [15]
The online calculator gives us the following output: 1 BOE = 5,551,365 Btus
The U.S. Energy Information Administration (EIA) International Energy Outlook 2013 (IEO2013) report mentioned in Section 4 above projects that total world energy use will rise from 524 quadrillion British thermal units (Btu) in 2010 to 630 quadrillion Btu in 2020 and to 820 quadrillion Btu in 2040. [8, 9]
In order to convert this amount of Btus into equivalent BOEs we need to divide 524 quadrillion British thermal units (Btu) by the Btu value of BOE to arrive at the number of barrels of oil equivalent or BOE.
Again, using the online calculator Unit Juggler (see link below) we arrive at the following values:
| 2010: 524 quadrillion Btus | = approx. 94,4 billion BOE |
| 2020: 630 quadrillion Btus | = approx. 113.4 billion BOE |
| 2040: 820 quadrillion Btus | = approx. 147.7 billion BOE |
To compare the above with the WEC/PSI figures, we need to make two conversions. First, we convert EJ – Exajoules to Btus and then we must convert Btus to BOE. As Unit Juggler cannot convert EJ to BOE we will use another online calculator Convert Units [16] to make this calculation and then Unit Juggler to obtain the BOE value.
| 879 EJ = 833,131,211,341,371,000 Btus | = 833 quadrillion Btus = 150 billion BOE | |
| 696 EJ =659,680,686,113,304,000 Btus | = 660 quadrillion Btus = 119 billion BOE | |
| 2050: Jazz scenario: | 833 quadrillion Btus = approx. 150 billion BOE | |
| 2050: Symphony scenario: | 660 quadrillion Btus = approx. 119 billion BOE |
Now we will look at the 2025 and the 2035 projections contained in the IEA World Energy Outlook 2013 report mentioned above. In this report energy values are expressed in terms of Mtoe or Million Tons of Oil Equivalent. The Total Primary Energy Source (TPES) for the year 2025 is 14,200 Mtoe in the 450 scenario and 15,800 Mtoe in the NPS scenario. For the year 2035 we find 14,800 Mtoe in the 450 Scenario and 17,300 Mtoe in the NPS scenario.
Using Unit Juggler we arrive at the following conversions:
| 2025: 11,750 Mtoe | = approx. 101.4 billion BOE |
| 2025: 15,800 Mtoe | = approx. 113 billion BOE |
| 2035: 14,800 Mtoe | = approx. 106 billion BOE |
| 2035: 17,300 Mtoe | = approx. 123.6 billion BOE |
Now we can compare all of the reports by year in terms of BOE:
| 2010: (US-EIA) | = approx. 94,4 billion BOE |
| 2020: (US-EIA) | = approx. 113.4 billion BOE |
| 2025: (IEA 450) | = approx. 101.4 billion BOE |
| 2025: (IEA NPS) | = approx. 113 billion BOE |
| 2035: (IEA 450) | = approx. 106 billion BOE |
| 2035: (IEA NPS) | = approx. 123.6 billion BOE |
| 2040: (US-EIA) | = approx. 147.7 billion BOE |
| 2050: (WEC/PSI Symphony) | = approx. 119 billion BOE |
| 2050: (WEC/PSI Jazz) | = approx. 150 billion BOE |
Even though we do not have exact year-by-year comparisons, we find that the projected energy trends are relatively consistent with some expected variations among the different approaches and philosophies of the various energy organizations.
Now we will look at the estimated value of the energy market in the years 2020, 2035, 2040 and 2050 using the price per barrel of oil estimates contained in the EIA 2013 report.“With prices expected to increase in the long term, due to demand from the developing countries and increasing world population, the world oil price in real 2011 dollars reaches $106 per barrel in 2020 and $163 per barrel in 2040 in the IEO2013 Reference case.”
(Please note we have used the EIA pegged US $ value 2011 to calculate the table below.)
To arrive at a realistic estimate of the price of energy in the future years we will use the following prices per barrel of oil: $80 for year 2010, $106 for year 2020, $120 for year 2025, $150 for year 2035, $163 for year 2040 and $170 for year 2050.
Projected Energy Market until 2050
| 2010:(US-EIA) | 94,4 billion BOE x $80 | = approx. $ 7.6 trillion |
| 2020:(US-EIA) | 113.4 billion BOE x $106 | = approx. $ 12.0 trillion |
| 2025:(IEA 450) | 101.4 billion BOE x $120 | = approx. $12.2 trillion |
| 2025: (IEA NPS) | 113 billion BOE x $120 | = approx. $13.6 trillion |
| 2035: (IEA 450) | 106 billion BOE x $150 | = approx. $15.9 trillion |
| 2035: (IEA NPS) | 123.6 billion BOE x $150 | = approx. $18.5 trillion |
| 2040: (US-EIA) | 147.7 billion BOE x $163 | = approx. $24.1 trillion |
| 2050:( WEC/PSI Symphony) | 119 billion BOE x $170 | = approx. $20.2 trillion |
| 2050:(WEC/PSI Jazz) | 150 billion BOE x $170 | = approx. $25.5 trillion |
Energy and Prosperity
So far we have been looking at projected future demand for energy and the associated end user price. All the reports assume the developing countries will develop faster than today while the already developed countries will develop at a slower pace. This makes sense, however the reports do not state that the developing countries will attain the same level of energy affluence found in the developed countries. Let’s look at the world’s per capita energy use. In 2010 the world’s population was approximately 6.9 billion people. If will divide 94.4 billion BOE used in that year by 6.9 billion people we arrive at 13.68 per capita BOE for the world in the year 2010.
The US EIA International Energy Statistics [17] gives us the per capita energy consumption per region and per country expressed in Btus. To compare with the number above we find that the per capita Total Primary Energy Consumption is 74.386 million Btus in the year 2010.
Using the Unit Juggler converter once again we can make the following calculations:
74,386,000 Btus = approx. 13.4 per capita BOE which is very close to our own calculation above.
Now let’s look at some other regions and then some countries.
| North America: | 259,706,000 Btus | = approx. 46.8 per capita BOE |
| Europe: | 138,169,000 Btus | = approx. 24.9 per capita BOE |
| Central & S. America | 56,840,000 Btus | = approx. 10.2 per capita BOE |
| Asia and Ocenia | 50,925,000 Btus | = approx. 9.2 per capita BOE |
| Africa: | 15,926,000 Btus | = approx. 2.9 per capita BOE |
| World: | 74,386,000 Btus | = approx. 13.4 per capita BOE |
Using the standard of living found in Europe and its associated per capita of 24.9 BOE as an ideal for the world we find that economic disparity will persist in the projected energy consumption figures.
Considering that in the next decades the emerging and developing countries will aspire to a similar use of energy as the people in Europe in order to raise their standard of living to similar level, we can use a per capita 25 BOE as an ideal goal for global energy consumption and call it the Energy and Prosperity for Everyone goal or (EPE).
Assuming world population stabilizes at 9 billion in the year 2050 and the emerging economies have had sufficient development to actually reach this goal we can now calculate how much energy would be necessary to reach the EPE standard worldwide. In this case we will multiply 9 billion people by per capita 25 BOE to reach the EPE level of 225 billion BOE. Now we will compare the most optimistic scenarios in terms of prosperity of the previous mentioned projections by the WEC/PSI report.
| 2050 Jazz: | 150 billion BOE divided by 9 Billion people | = 16.7 per capita BOE |
| 2050 Symphony: | 119 billion BOE divided by 9 Billion people | = 13.2 per capita BOE |
| EPE: | 225 billion BOE divided by 9 Billion people | = 25 per capita BOE |
The above shows us that there will still be substantial discrepancy in the year 2050 with either of the Jazz or the Symphony scenarios: i.e. the developing countries will never reach the standard of living of today’s European societies and the developed countries will most likely have to lower their standard of living and energy use to comply with the world energy estimates especially while trying to comply with the IPCC CO2 goals that are already influencing governmental and industrial policies.
Now we need to make one more calculation to discover the potential size of the energy market in the year 2050 in our EPE scenario. Using the anticipated price per barrel of oil of US $170 that we used above we arrive at a projected world energy market of $38.25 trillion (which does not include any investment in energy optimization technologies such as CC(U)S, etc. )
225 billion BOE x $170 = approx. $ 38.25 trillion
Thus, at this moment there exists an energy and environmental dilemma that obviously needs to be solved. However, there also exists a gigantic market for supplying energy at the projected levels and prices. As the studies point out, absence of any viable alternative energy resource, the primary source of energy in the near term will continue to be based on fossil fuels as these are less expensive but their use results in higher CO2 emissions. Not only is this predicted by the IPCC 5th assessment report to have serious consequences for the climate but perhaps even more importantly, such increases in the use of fossil fuels between now and the year 2050 may be even worse for the environment in terms of pollution. The reports also predict that the current energy boom in the US, i.e. fracking for shale oil and gas or tight oil, will not be duplicated elsewhere in the world and that this boom will taper off and begin declining in 2020 and, that by 2030, the world’s major fossil fuel production will again come from the Middle East.
As before, we can anticipate that the supply of fossil fuels will be accompanied by geopolitical competition and conflicts over the remaining resources. For example, the political temperature in the Arctic rose on December 10, 2013 when Vladimir Putin vowed to step up Russia's military presence in the region in response to a claim by Canada to the North Pole. Not only Russia and Canada, but also the US, Greenland, and Danish have heightened interests in claiming the Artic territory which, according to the US geological survey, contains 30% of the world's undiscovered natural gas and 15% of its oil. [18]
Alternative terrestrial renewable energy sources such as hydropower, geothermal, photovoltaic and wind, though desirable and important additions to the world’s energy mix, apparently cannot scale to meet these future energy demands. The WEC/PSI report asserts that energy production from these sources will remain a modest fraction of the total energy picture as these technologies are unlikely to provide the huge amounts of new and sustainable energy that will be needed in the coming decades. Likewise, use of nuclear energy will increase at about the same pace, however it is also not a viable option because of its unsolved political and environmental issues as well as the high start-up costs. It has been estimated that we would need to build 11,000 to 12,000 nuclear power plants by year 2050 to meet this predicted energy demand or possibly more because the average age of a nuclear plant is around only around 21 years. [19]
Final Thoughts
A key element of The Space Option concept is the utilization of extraterrestrial resources for meeting the needs of humanity on Earth. Plentiful and environmentally friendly energy is perhaps the most important resource for the future sustainability of our civilization. Energy from space in the form of solar power which is often referred to as Space Based Solar Power (SBSP) has been looked at for several decades. We believe it has the potential to meet much - if not all - of civilization’s future energy needs and, as it is environmentally benign, meaning that it is CO2 neutral and does not produce harmful pollutants, it can help society realistic address its environmental and energy challenges. Astonishingly, this attractive alternative energy resource is not included nor referenced in today’s energy debates, predictions and policies.
Development and population increases will stimulate a burgeoning energy market of enormous proportions. In order for the global economy to increase by incorporating the less developed regions of the world, it will need substantially more energy than is being produced and used today. The world’s top energy organizations tend to agree that humanity will remain dependent on fossil fuels to meet its energy needs throughout mid-century and this will have a negative impact on meeting its CO2 reduction goals. Government interventions to do so will significantly add to the cost of energy and restrict the pace of development in the emerging economies.
This is both a challenge and an opportunity for the energy sector, especially when this has to be achieved in the context of CO2 reduction policies. If we strive for the EPE goal - Energy and Prosperity of Everyone - then our civilization will need almost twice as much energy as the energy organizations are predicting that will be available in the year 2050.
Therefore, if there existed a viable environmentally clean energy option which was CO2 neutral and one that has the potential to meet a substantial portion of our civilization's future energy needs and would avoid geopolitical conflicts over resources and territory, then this should be the obvious choice that humanity would soon want to make.
Fortunately, as The Space Option has pointed out in previous publications, the alternative to terrestrial energy resources is Space Based Solar Power (SBSP). Considering a potential energy market of $20-38 trillion in the year 2050 and beyond – even if it supplies just 10% of that future market - SBSP would appear to be an attractive opportunity. As such, it is one of those Cosmic Choices that our civilization needs to make to insure its sustainability and viability.
However we must also ask, “If the case for SBSP, as a possible solution to meeting the energy and climate challenges of the future is so compelling, why it is not even mentioned by the world energy organizations when considering the future energy needs of our civilization?”
This will be the subject of future articles.
References:
- Climate Change 2013: The Physical Science Basis
http://www.ipcc.ch/report/ar5/wg1/#.UqwYwuKab-4 - The Trillion-Ton Cap: Allocating The World's Carbon Emissions
http://e360.yale.edu/feature/the_trillion-ton_cap_allocating_the_worlds_carbon_emissions/2703/ - www.trillionthtonne.org – University of Oxford e-Research Centre
http://www.trillionthtonne.org - IPCC climate report: the digested read
http://www.theguardian.com/environment/2013/sep/27/ipcc-climate-report-digested-read - World Energy Scenarios Composing energy futures to 2050_Executive summary.
http://www.worldenergy.org/wp-content/uploads/2013/10/World-Energy-Scenarios_Composing-energy-futures-to-2050_Executive-summary.pdf - World Energy Scenarios Composing energy futures to 2050, Full Report:
http://www.worldenergy.org/wp-content/uploads/2013/10/World-Energy-Scenarios_Composing-energy-futures-to-2050_Full-report1.pdf - A Glimpse into the Future: Paul Scherer Institute, October 2013
http://www.psi.ch/info/MediaBoard/Energiespiegel_22_e.pdf - What are the energy realities? Challenging the myths, defining the future, Nov. 10, 2013
http://www.worldenergy.org/news-and-media/news/world-energy-council-releases-major-studies-at-world-energy-congress/ - U.S. Energy Information Administration (EIA)The International Energy Outlook 2013
http://www.eia.gov/forecasts/ieo/pdf/0484%282013%29.pdf - IEA WORLD ENERGY OUTLOOK 2013 FACTSHEET How will global energy markets evolve to 2035?
http://www.worldenergyoutlook.org/media/weowebsite/factsheets/WEO2013_Factsheets.pdf - IEA ENERGY OUTLOOK 2013 Executive Summary
http://www.iea.org/publications/freepublications/publication/WEO2013_Executive_Summary_English.pdf - IEA 2013 Key World Energy Statistics
http://www.iea.org/publications/freepublications/publication/KeyWorld2013_FINAL_WEB.pdf - IEA World Energy Outlook 2013 Press Release, Nov. 12, 2013
http://www.worldenergyoutlook.org/media/weowebsite/2013/WEO2013pressrelease.pdf - IEA World Energy Outlook Special Report: Redrawing the Energy-Climate Map
http://www.iea.org/publications/freepublications/publication/WEO_Special_Report_2013_Redrawing_the_Energy_Climate_Map.pdf - Unit Juggler – Convert Everything with Ease
http://www.unitjuggler.com/convert-energy-from-Btu-to-boe.html - Convert Units: Energy unit conversion - SI derived quantity
http://www.convertunits.com/type/energy
http://www.convertunits.com/from/exajoule/to/British+thermal+unit - US EIA International Energy Statistics
http://www.eia.gov/cfapps/ipdbproject/iedindex3.cfm?tid=44&pid=45&aid=2&cid=regions&syid=2010&eyid=2010&unit=MBTUPP - Russia to boost military presence in Arctic as Canada plots north pole claim
http://www.theguardian.com/world/2013/dec/10/russia-military-arctic-canada-north-pole - NEI Nuclear Notes: How many nuclear plants does it take to meet the world's energy needs?
http://neinuclearnotes.blogspot.ch/2008/03/how-many-nuclear-plants-does-it-take-to.html - Converterin - Terawatthour to Petawatthour Converter
http://converterin.com/fuel-economy/terawatthour-to-petawatthour.html